
Water Quality Monitoring
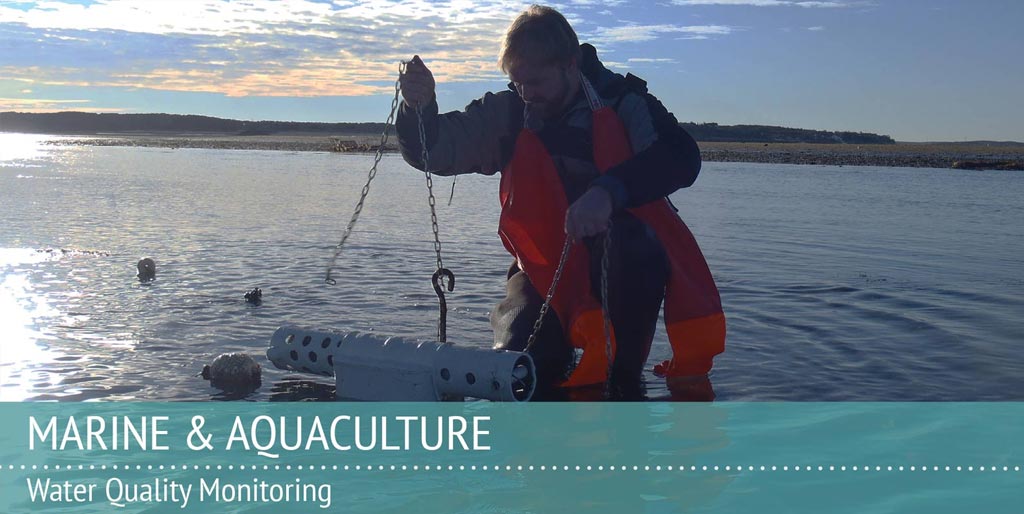
The Water Monitoring Process
The water quality conditions are monitored using Yellow Springs Instruments Inc (YSI) sondes, which can monitoring multiple parameters with a single device. Measurements of all water quality parameters are recorded by the YSI sondes every 15 minutes and stored internally. This data is then uploaded directly from the sondes to a computer for analysis. However, two of our monitoring sites, Wellfleet Harbor and Cotuit Bay, are equipped with solar powered boxes which transmit readings every 15 minutes via a cellular modem. The cellular information is then sent to a website, where it can be viewed in real-time.
Click here to view the real time data from Cotuit. Click on the box that says “Cotuit Bay” to see the data. Click here to view the real time data from Wellfleet. Click on the box that says “Wellfleet Harbor” to see the data.
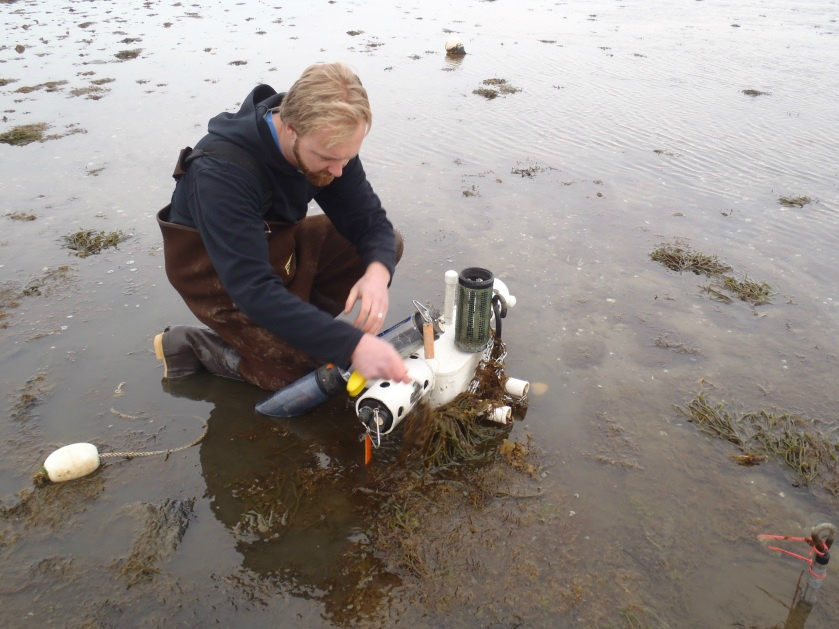
Due to the nature of the marine environment and the instrument sensors, the sondes are deployed for only 2-4 weeks before they need to be taken in for cleaning and recalibration of sensors. When a sonde is removed from the water for cleaning, recalibration, and data acquisition it is replaced with another.
To prevent any possibility of ice damage to equipment, data is generally recorded from March/April through November/December.
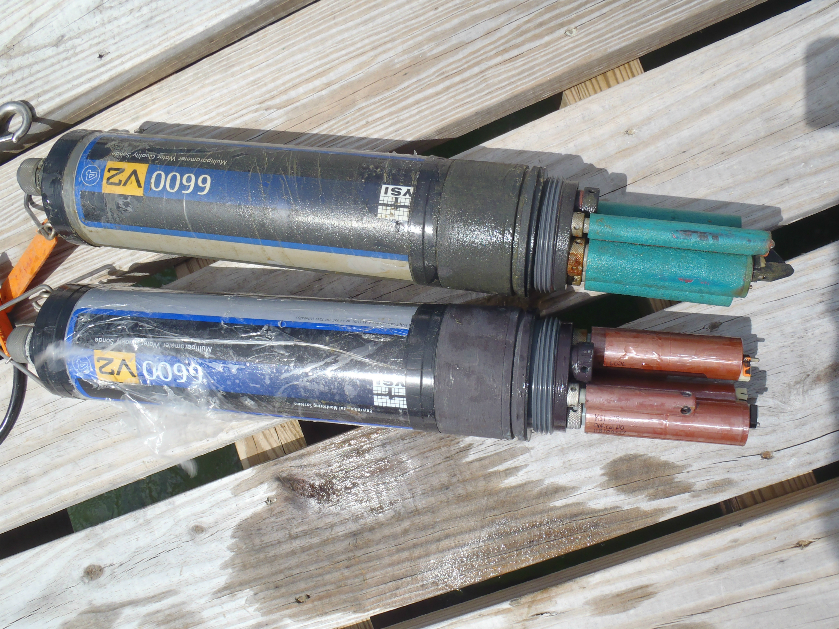
Water quality monitoring sondes. The actual sensors are the green and copper colored cylinders on the right side.
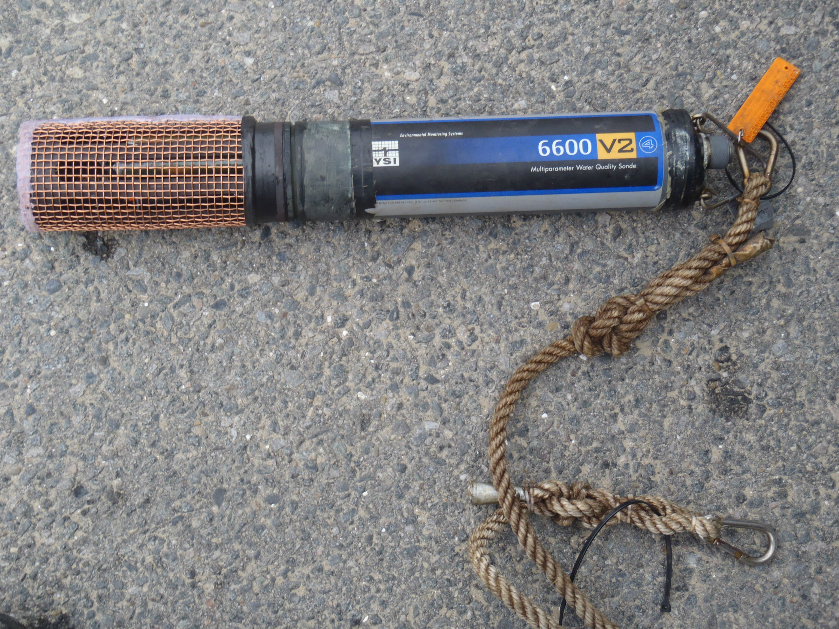
Water quality sonde with cage over the sensors. This helps protect the equipment while it’s in the water.
- Temperature
- Salinity, conductivity and total dissolved solids (TDS)
- Depth, pressure
- pH
- Dissolved oxygen
- Chlorophyll
- Turbidity
Who uses this data?
Shellfish growers, Shellfish Constables, State and Federal Agencies, Researchers, Environmental NGOs and Fisherman use this data. Requests have come from local researchers looking into water quality dynamics, long distance researchers interested in benthic worm populations, and entrepreneurs interested in sea salt production. The Marine Program has used the water quality equipment for troubleshooting at aquaculture facilities (both fish and shellfish), for eelgrass restoration work, and to quantify the ability of oysters to clear the water.
Why do we Monitor these 9 Water Quality Parameters?
Temperature: Temperature is often one of the most important factors influencing the growth and activity of marine plants and animals. Many other water quality parameters and biological processes may also be influenced by temperature. There is also evidence that certain parasites and other potential pathogens to fish and shellfish vary in abundance according to physical properties like temperature and salinity. The temperature can be recorded in both Fahrenheit (F) or Celsius (C) and converted using the following conversion equations: °F = (1.8 x °C) +32 and °C = (°F-32) x 0.555
Salinity (ppt = parts per thousand): The percentage of salts dissolved in full strength seawater is approximately 3.5% (or 35 ppt) and can vary slightly depending on location, depth and season. Factors that may dilute or lower salt concentrations include precipitation, river or storm water runoff, and ice melt. For instance, a lower level of salt concentration may occur after the influence of storm water runoff from a nearby drain or parking lot. Conversely, the salt concentration may be increased by evaporation or drought. Changes in salinity can stress marine organisms, as well as allow the opportunity for proliferation of different fouling or pathogenic organisms.
Total Dissolved Solids (g/L): Total dissolved solids (TDS) is the amount of dissolved solids in a certain volume of water. This parameter is related to the amount of dissolved salts and minerals in the water.
Conductivity (mS/cm): Conductivity is the measurement of the ability of water to carry an electric current. Conductivity is used to help determine TDS and salinity values. After the specific conductivity reading is obtained, it is used in an equation to calculate both salinity and TDS. As conductivity increases so does the salinity and TDS.
Depth (m): The depth is measured in meters (1 meter = 3.28 feet) using a pressure sensor. It is important to know the depth at which the parameters are measured because of factors which may affect the parameter at various depths. There are several reasons to consider the depth when measuring water quality parameters. Examples: water temperature, chlorophyll, and turbidity generally decrease as the depth increases while salt concentrations generally increase with depth. Small variations in typical measurements could be the result of changing depth depending on the sonde location and placement or recent rainfall events.
Depth can also be used to figure the height or amplitude of a tide at stations where the sonde is at a fixed level and does not rise and fall with the tide. The YSI sonde stations used by the Cape Cod Cooperative Extension are at fixed level at most sites (Wellfleet Harbor, Pleasant Bay, and Cotuit Bay) and allow for tide measurement. The Barnstable Harbor site moves up and down with the tide and provides a constant measurement of water parameters just below the surface.
pH: In scientific terms pH stands for “potential hydrogen” which is an overall measure for the acid/alkaline balance. The pH level is measured on a scale from 0 to 14 where 0 is the highest acidic concentration and 14 is the most alkaline. The pH of a body of water or solution is determined by the hydrogen ion concentration activity and is expressed mathematically as pH = -log [H]. It is important for pH to remain at a relatively balanced level for a lot of marine life as changes can affect physiological processes like the ability to utilize oxygen or the availability of calcium carbonate. The average pH of ocean surface water is approximately 8 but varies with environmental circumstances. Ocean acidification, or a decrease in pH, has become an increased concern over the past decades as increased atmospheric carbon dioxide is dissolved in the oceans, further warranting the long term observances of pH levels.
DO (or ODO): Dissolved oxygen (DO) is an important parameter to measure because it strongly characterizes the health of a water body as a necessary element for marine life. DO is measured as the amount of gaseous oxygen (O2) dissolved in water, and is measured by the YSI sondes in both percentage saturation (%) and milligrams per liter (mg/L). Algae normally produce oxygen through respiration such that measured surface DO levels are often higher during daylight hours. A low DO level may indicate high levels of decaying algae and/or waste products. Low DO levels could also be the result of warmer water temperatures as the oxygen capacity of water is inversely correlated with water temperature, i.e. as water temperature increases the DO saturation level of the water decreases. Depending on the particular probe used the DO will be expressed as DO or ODO (optical dissolved oxygen).
Chlorophyll (ug/L): Chlorophyll is a pigment that is responsible for photosynthesis in plants. Obtaining a chlorophyll concentration measurement is a way to estimate phytoplankton levels as chlorophyll is directly linked with the amount phytoplankton or algae suspended in the water. Phytoplankton consume available dissolved nutrients and carbon dioxide with the aid of sunlight during photosynthesis, which results in energy for the algae and oxygen which is released to the surrounding water. Understanding phytoplankton populations and their distributions can help understand the health of a water body, as the algae serve as a base food source for the ecosystem, but may also indicate conditions of eutrophication as nutrient levels start to overload the system. Higher levels of algae (chlorophyll concentration) can cloud the waters so that the bottom is shaded, hampering photosynthesis by submerged vegetation and decreasing dissolved oxygen available at the bottom. Also as algae bloom then settle and decay on the bottom, oxygen is used by bacteria consuming the decaying algae further removing available oxygen from the system.
Turbidity (nephelometric turbidity units or NTUs): This measurement reflects the amount of suspended solids in the water, or the overall clarity or cloudiness. If the water is cloudy it may indicate increases in the amount of suspended particulates. Sometimes the suspended particulates can direct us to potential situations causing change in turbidity readings such as coastal erosion, runoff, waste discharges, and planktonic organisms. Increased levels of turbidity will often impede light transmittance through the water which is of importance to submerged aquatic vegetation like sea grasses, which provide habitat to a number of species.
The Marine Program of Cape Cod Cooperative Extension maintains 5 long-term marine water quality monitoring stations in Southeastern Massachusetts. Data from these sites are posted below in weekly summary format and updated periodically as staff perform quality control. Data is available in many other formats down to the scale of every 15 minutes. For more specific requests beyond what is available here please contact the Marine Program staff. Note, before using this data please be aware of the usage policy and data disclaimer below.
2019 Barnstable Harbor Weekly Means
2019 Cotuit Bay Weekly Means
2019 Duxbury Bay Weekly Means
2019 Pleasant Bay Orleans Weekly Means
2019 Wellfleet Harbor Weekly Means
2018 Barnstable Harbor Weekly Means
2018 Cotuit Bay Weekly Means
2018 Duxbury Bay Weekly Means
2018 Pleasant Bay Orleans Weekly Means
2018 Wellfleet Harbor Weekly Means
2017 Barnstable Harbor Weekly Means
2017 Cotuit Bay Weekly Means
2017 Duxbury Bay Weekly Means
2017 Pleasant Bay Orleans Weekly Means
2017 Wellfleet Harbor Weekly Means
2016 Barnstable Harbor Weekly Means
2016 Cotuit Bay Weekly Means
2016 Duxbury Bay Weekly Means
2016 Pleasant Bay Weekly Means
2016 Wellfleet Harbor Weekly Means
2015 Barnstable Weekly Means
2015 Cotuit Bay Weekly Means
2015 Duxbury Bay Weekly Means
2015 Pleasant Bay Weekly Means
2015 Wellfleet Harbor Weekly Means
2014 Barnstable Harbor Weekly Means
2014 Cotuit Bay Weekly Means
2014 Duxbury Bay Weekly Means
2014 Pleasant Bay Weekly Means
2014 Wellfleet Harbor Weekly Means
2013 Barnstable Harbor Weekly Means
2013 Cotuit Bay Weekly Means
2013 Duxbury Bay Weekly Means
2013 Pleasant Bay Weekly Means
2013 Wellfleet Harbor Weekly Means
2012 Barnstable Harbor Weekly Means
2012 Cotuit Bay Weekly Means
2012 Pleasant Bay Weekly Means
2012 Wellfleet Harbor Weekly Means
2011 Barnstable Harbor Weekly Means
2011 Cotuit Bay Weekly Means
2011 Pleasant Bay Weekly Means
2011 Wellfleet Harbor Weekly Means
2010 Barnstable Harbor Weekly Means
2010 Cotuit Bay Weekly Means
2010 Pleasant Bay Weekly Means
2010 Wellfleet Harbor Weekly Means
2009 Barnstable Harbor Weekly Means
2009 Cotuit Bay Weekly Means
2009 Pleasant Bay Weekly Means
2009 Wellfleet Harbor Weekly Means
2008 Barnstable Harbor Weekly Means
2008 Cotuit Bay Weekly Means
2008 Pleasant Bay Weekly Means
2008 Wellfleet Harbor Weekly Means
2007 Barnstable Harbor Weekly Means
2007 Pleasant Bay Weekly Means
2007 Wellfleet Harbor Weekly Means
2006 Pleasant Bay Weekly Means
2006 Wellfleet Harbor Weekly Means
2005 Pleasant Bay Weekly Means
2005 Wellfleet Harbor Weekly Means
2004 Pleasant Bay Weekly Means
2004 Wellfleet Harbor Weekly Means
Usage Policy:
These data are from the Cape Cod Cooperative Extension water quality monitoring program, with support from Barnstable County and the South Eastern Massachusetts Aquaculture Center (SEMAC). These data are available for scientific publication; though prior to any publication please consult with the Cape Cod Cooperative Extension.
Data Disclaimer:
Neither Cape Cod Cooperative Extension, Barnstable County, nor SEMAC shall be held liable for any reason related to the accuracy or fitness of the provided data. A comprehensive maintenance program is followed to keep the monitoring systems operating in optimum condition, however, factors such as biological growth, sedimentation and sensor malfunctions can lead to inaccurate measurements. Real-time and recent data has not undergone a QA/QC review process and therefore may not be an accurate representation of actual environmental conditions.